

Triphasic BBT Chart – Is It a Reliable Sign of Pregnancy?
Learn what a triphasic BBT chart means, what causes the third temperature shift, and how reliable it is as an early pregnancy sign.




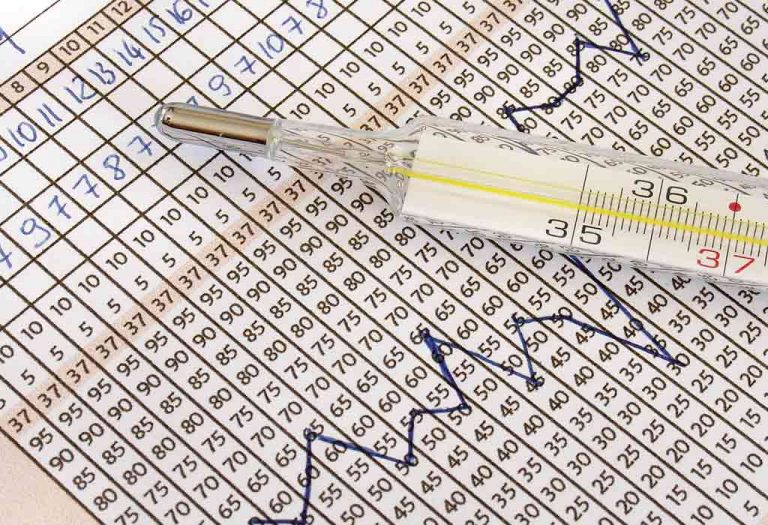
Couples who are eagerly anticipating the joys of parenthood can try one potentially telling indicator of pregnancy, which is called triphasic BBT chart, which is a basal body temperature (BBT) chart that displays three distinct temperature phases during one menstrual cycle, rather than the usual two-phase pattern associated with ovulation. But how reliable is this chart as a definitive sign of pregnancy? A triphasic pattern doesn’t guarantee pregnancy because temperature can be affected by several factors like sleep changes or illness. In this article, we will delve into the world of triphasic charts, exploring their potential significance and accuracy in detecting early pregnancy.
What Is a Triphasic Chart?
So, what exactly is a triphasic chart? Well, this chart is a Triphasic BBT chart or basal body temperature chart women use to track their body temperature during three different phases of ovulation. Ovulation is biphasic, which means the temperature variations can be seen pre and post-ovulation. However, there is a third phase in which the body temperature also changes, and that takes place around a week to ten days after ovulation. This third phase is usually associated with a rise in progesterone levels.
Also, towards the second half of the menstrual cycle (the luteal phase), progesterone is released to prepare the uterine lining for a fertilized zygote to attach or implant. Whether or not fertilization takes place, the ripening of the uterine wall will happen after each ovulatory phase. The increased amounts of progesterone hormones in the body result in increased body temperature. Therefore, triphasic basal body temperature (BBT) may not be a sure-shot sign of pregnancy. However, according to research, a chart indicating a triphasic pattern is more likely to be of a pregnant woman than a non-pregnant one.
How Common Is a Triphasic Chart?
According to a study, among the 150,000 women whose temperatures were recorded in BBT charts, 12 per cent of all women whose charts showed triphasic patterns were pregnant (1). Therefore, if your basal body temperature chart shows triphasic patterns, the chances are that you could be pregnant!
Why Do We Use the Triphasic Chart?
A triphasic chart can be used for multiple reasons, some of which include:
1. To Track Changes After Ovulation
A BBT chart can help track the temperature shift around ovulation and the menstrual phase. After ovulation, hormonal changes, especially increased progesterone, are responsible for a small rise in resting body temperature (2).
2. To Observe the Luteal Phase
Continuing to record temperatures after ovulation allows a person to observe how long the temperature remains elevated before menstruation or another significant change occurs.
3. To Understand Individual Cycle Patterns
Maintaining BBT records over several cycles can help women learn their own temperature patterns and observe what influences them.
4. To Support Fertility Awareness
BBT can provide useful information about reproductive patterns when used for interpretation alongside other signs like cervical mucus.
What Causes a Third Temperature Shift in the Triphasic Pattern?
The increase in the pattern can occur when you are pregnant, and when you are not. Let us understand how that may happen.
As per the Cleveland Clinic, your body produces progesterone that prepares your uterine lining for implantation of the embryo and also suppresses ovulation and prohibits contractions in the uterine muscles that could cause the female body to reject an egg. Also, when the embryo attaches, or the implantation takes place, there is an increased production of progesterone trimester by trimester (3), and this sudden increase can further spike the body temperature.
In case you are not pregnant, your triphasic chart may show temperature variations due to a number of other factors. A slight surge in hormonal levels, an illness that may slightly increase the body temperature (not a fever), and changes in the bedroom temperature can affect your body temperature, too.
What Is the Difference Between Triphasic Chart and BBT Chart?
Although the terms are related, they do not mean exactly the same thing. Let’s understand how.
| Feature | BBT Chart | Triphasic Chart |
| Basics | A chart that records basal body temperature throughout the menstrual cycle. The temperature is recorded after every morning after waking up, before doing any activity, getting out of bed, or having anything to eat or drink (2) | A BBT chart that appears to contain three distinct temperature phases |
| Importance | Helps observe temperature changes associated with ovulation (4) | Helps observe an additional temperature rise after the initial post-ovulation shift |
| Pattern | Usually shows a lower-temperature phase followed by a higher-temperature phase | Appears to show a lower phase, an initial rise, and another rise |
| Indication of Pregnancy | Rise in temperatures may occur after ovulation but does not confirm pregnancy | A third rise may occur in some cycles, but it is not a reliable pregnancy test |
| Clinical Diagnosis | It is not a pregnancy diagnostic test | It is not a clinically established method for diagnosing pregnancy. |
How to Identify and Diagnose a Triphasic Pattern?
Rather than calling the triphasic pattern a medical “diagnosis,” it is more accurate to use terms like “identify” or “interpret” a triphasic pattern. Here’s how the pattern is observed.
Step 1: Record Your BBT Every Morning
The first step is to diligently record your BBT. Take your temperature immediately after waking, before getting out of bed, eating, drinking, or engaging in physical activity (2). Try to measure it at approximately the same time each day.
Step 2: Establish Your Pre-Ovulation Temperature Pattern
You may notice that temperatures are generally lower during the first part of the menstrual cycle, and that’s normal. Individual temperatures naturally fluctuate, so it is more useful to observe the overall pattern rather than focus on one reading.
Step 3: Look for the Initial Temperature Rise
Following ovulation, progesterone can cause BBT to increase slightly. A sustained rise compared with earlier-cycle temperatures may indicate that ovulation has already occurred.
Step 4: Continue Charting During the Luteal Phase
Keep recording your temperature rather than stopping after the first rise. This allows you to see whether the elevated pattern remains stable or changes again.
Step 5: Look for a Possible Third Phase
A chart may be described as triphasic when, after the initial post-ovulation rise, temperatures appear to increase again and remain elevated. However, there is no single universally accepted temperature threshold that makes a chart a confirmed pregnancy-related triphasic pattern.
Step 6: Consider Other Factors
A temperature increase does not necessarily mean pregnancy. The Mayo Clinic notes that fever, illness, infections, certain medications, disrupted sleep, alcohol, stress, changes in waking time, travel, medical conditions like hypothyroidism, and measurement differences can influence BBT readings (5) (6).
Step 7: Confirm Pregnancy Separately
If your period is late and pregnancy is possible, use an appropriate pregnancy test rather than relying on a triphasic chart. A temperature pattern can be an observation worth tracking, but it cannot establish that implantation or pregnancy has occurred.
Does the Triphasic Chart Indicate Implantation?
Whether the triphasic chart indicates implantation or not, cannot be clearly stated because there is not much scientific evidence available to support it. There are just some empirical values available to support the claim. The process of implantation occurs only when there is an existing pregnancy. The important point of consideration is that the third phase of the temperature shift also starts happening when the implantation starts happening. For this very reason, there have been beliefs and claims that the triphasic chart is an indication of implantation. Sadly, there are not enough pieces of evidence on the triphasic pregnancy chart.
Is a Triphasic Chart a Sign of Pregnancy?
No, the triphasic chart is not a clear sign of pregnancy. Your triphasic chart can show temperature variations due to many causes such as the ones mentioned in the article above and not only because of pregnancy alone. You may be tempted to take an early pregnancy test if you see a triphasic pattern to confirm your pregnancy. However, we do not think that is a good idea because the pregnancy tests check for the hCG hormones and not the increased levels of progesterone.
If your progesterone levels are high, it does not mean that your pregnancy or hCG hormone levels are high too. And, if you take a test, the chances are that you may get a negative result, which may put you off. It is recommended that you wait until your period is late or until you have more high days (18 or more) on your chart to take the test. But, if you have a well-documented cycle curve, you can count days from your first high-temperature measurement to evaluate your chances of pregnancy. If you record more than 18 high days, well, it is quite likely that you are going to be a mommy!
When You Should Take the Pregnancy Test?
The most common and reliable time to take a pregnancy test is after you’ve missed your expected period. Most over-the-counter pregnancy tests are designed to detect the hormone hCG (human chorionic gonadotropin), which increases when you’re pregnant. It’s best to wait until a week from the day of your missed period or a few days afterwards for the most accurate results.
FAQs
1. Does a triphasic BBT chart mean I am pregnant?
No, not necessarily. A third temperature rise can occur for various reasons other than pregnancy, so a triphasic pattern should not be taken as a confirmation for pregnancy.
2. How long should BBT stay elevated to suggest pregnancy?
There is no “fixed” number of elevated days on a BBT chart that can confirm pregnancy. Nonetheless, sustained high temperatures can also occur during a normal luteal phase.
3. Why did my temperature rise for a third time but my pregnancy test was negative?
A third temperature rise does not always indicate pregnancy. Normal cycle variation, illness, sleep disruption, alcohol, stress, or measurement differences can affect BBT readings.
4. What is the BBT of a pregnant woman?
The Basal Body Temperature (BBT) of a pregnant woman typically remains elevated, above her normal pre-ovulation levels, due to hormonal changes. It can be used as an indicator of pregnancy when it stays elevated for an extended period. Temperature during pregnancy generally hovers between 97.7°F and 98.8°F (36.5°C–37.1°C). But your personal baseline matters more than an exact number.
The BBT chart, or your basal body temperature chart, is a great parameter to know about your menstrual cycle and ovulation days; you can find out which days are your most fertile days in a month. Many women may feel excited to find changes in their triphasic pattern as a sign of pregnancy. Well, as discussed in this post, there are chances that you have a triphasic pattern, but that is not a clear indication that you are pregnant. Again, the most accurate indicators of pregnancy are your missed period and a positive pregnancy test. Therefore, relying solely on such indicators to confirm pregnancy may not be a viable thing to do.
Some fertility trackers consider a second temperature rise after ovulation a possible early pregnancy clue. However, a triphasic pattern does not confirm pregnancy because temperature can be affected by several factors, including illness, sleep changes, alcohol, stress, and differences in measurement. BBT tracking can help identify that ovulation has occurred, but it cannot reliably diagnose pregnancy. A pregnancy test remains the appropriate way to confirm pregnancy.
Also Read:
Is Diarrhoea a Sign of Being Pregnant?
Pregnancy Symptoms You Shouldn’t Ignore
Uncommon Signs & Symptoms of Pregnancy
How To Calculate Pregnancy By Months, Weeks & Trimesters?
Was This Article Helpful?
Parenting is a huge responsibility, for you as a caregiver, but also for us as a parenting content platform. We understand that and take our responsibility of creating credible content seriously. FirstCry Parenting articles are written and published only after extensive research using factually sound references to deliver quality content that is accurate, validated by experts, and completely reliable. To understand how we go about creating content that is credible, read our editorial policy here.
- Author

Related Articles
-

False Pregnancy (Pseudocyesis): Symptoms, Causes, and Treatment
-

Can You Be Pregnant Without Any Symptoms? Know the Facts
-

Pregnancy Symptoms After Missed Period - Am I Pregnant?
-

Linea Nigra: Causes, Myths, Facts & Prevention
-

Cramps But No Period: Causes and Treatment
-
Can Pregnancy Symptoms Come and Go? Here's What You Should Know