Basal Body Temperature (BBT): Chart, Tracking, & more


Medically Reviewed By
Dr. Prerna More Patel
(Gynecologist/Obstetrician)

: Chart, Tracking, & more")
This health content has been medically reviewed by qualified experts and follows the FirstCry Parenting editorial policy to ensure accuracy and reliability.
Are you tired of using those pesky hormonal contraceptives or trying to conceive without success? Then, it’s time to get in touch with your body’s natural rhythm! One method you can use is tracking your basal body temperature (BBT). This little-known technique involves taking your temperature first thing in the morning and recording it on a chart. Not only can it help you avoid unwanted pregnancies, but it can also increase your chances of conceiving. In this article, we’ll walk you through the process of charting your BBT and interpreting the data, so you can take control of your reproductive health like a boss!
Tracking and interpreting basal body temperature is one of the methods employed by women who want to use natural contraception methods. It is also an indicator of the most fertile period for women who are aiming to conceive. This article helps you understand the ‘why’ and ‘how’ of the process, and guide you in creating a basal body temperature chart for yourself.
What Is Basal Body Temperature (BBT)?
Basal body temperature (BBT) is the lowest body temperature that is attained in a 24-hour period. This would obviously be when you are at rest. A thorough pattern obtained by a few months reading of your BBT will give you a better picture of your ovulation period and timings.
You should measure your BBT before you do any physical activity that might alleviate your body temperature. Ovulation may slightly raise your BBT levels,so noting down your BBT over time may reveal the corresponding variations. That is what makes the BBT a natural method to keep track of your menstrual cycle, especially if you are trying to get pregnant. If you measure your temperature after performing some physical activity, the false and somewhat higher value of BBT can result in wrongly identifying the phase of the menstrual cycle.
BBT levels are known to hike slightly during ovulation. Therefore, recording your temperature over a period of time will show you a pattern and variations whenever they occur. This way, you will be able to keep track of your menstruation cycle which is very helpful if you are trying to get pregnant.
How Does BBT Method Work?
So, how does this BBT method work, you ask? Well, it’s all about paying attention to your body’s temperature fluctuations throughout your menstrual cycle. Basically, your BBT is the temperature of your body at rest, and it changes slightly depending on where you are in your cycle.
To take your BBT, you’ll need a basal thermometer (which is more accurate than a regular thermometer) and a little bit of patience. Simply take your temperature first thing in the morning, before you get out of bed, and record it on your BBT chart. Over time, you’ll start to see patterns emerge, which can help you predict when you’re most fertile or when you’re at a lower risk of pregnancy. And if you do conceive, your BBT will stay elevated, indicating that you’re pregnant.
So, if you’re ready to become a BBT expert, keep reading for tips on how to take your temperature accurately and what to do with all that data!
Advantages And Disadvantages Of BBT Method

Alright, let’s dive into the pros and cons of the BBT method! While taking your basal body temperature may seem like a simple enough task, it’s important to understand the potential benefits and drawbacks before relying on it as a contraceptive or fertility tool. So, grab your thermometer and let’s explore what the BBT method can do for you (and what it can’t)!
Benefits
Who doesn’t love a good list of benefits? When it comes to the BBT method, there are plenty of reasons to consider giving it a try. From being a natural and hormone-free option to providing valuable insights into your body’s natural rhythm, there are many perks to tracking your basal body temperature. So, get ready to learn why so many women swear by the BBT method for contraception and conception purposes!
- Natural and hormone-free method
- It can be empowering to understand your body’s natural rhythm
- Inexpensive and can be used in conjunction with other methods
- Can be used by women with certain health conditions that may prevent them from using other forms of birth control, such as blood clotting disorders
- Can be a helpful tool for identifying irregular cycles or underlying health issues that may affect fertility
Drawbacks
As much as we’d love for the BBT method to be the perfect solution for everyone, it’s not without its drawbacks. Whether you’re struggling with irregular cycles or find it difficult to stay consistent with your tracking, there are a few potential downsides to keep in mind. But don’t worry, we’ve got you covered with all the information you need to make an informed decision about whether the BBT method is right for you. So, let’s explore some of the challenges you may encounter when using this natural contraceptive or fertility tool.
- Requires consistency and diligence to be effective
- Takes several months of tracking to establish a pattern
- Factors like illness, stress, or poor sleep can affect readings, making it less reliable
- May not be effective for women with irregular cycles or who experience frequent temperature fluctuations
- Requires abstinence or other forms of birth control during the fertile period, which can be difficult to manage consistently for some women
Is There Any Risk Of Using Basal Body Temperature Method?
Ah, the age-old question of whether there are any risks involved in using the BBT method. While it’s generally considered a safe and natural option, there are a few things to keep in mind.
- Firstly, it’s important to note that relying on the BBT method alone for contraception may not be as effective as using other forms of birth control. So, if you’re not ready to become a parent, it’s best to use the BBT method in conjunction with other methods such as condoms or spermicide.
- Another potential risk to consider is that tracking your basal body temperature can be a source of stress or anxiety for some women. If you find yourself becoming overly focused on your temperature readings or feeling overwhelmed by the process, it may be a good idea to take a break or seek support from a healthcare provider.
All that said, for many women, the benefits of the BBT method far outweigh any potential risks, so don’t let these concerns deter you from exploring this natural contraceptive or fertility tool. Do consider them and make an informed decision on how to proceed.
How to Track BBT?
So, how do you measure basal body temperature? Let’s start with the basics first, by learning about the device used to measure it, which is a BBT thermometer.
Basal thermometers or BBT thermometers are recommended over digital thermometers to measure BBT as they are sensitive enough to record the most minute changes that occur in your body as compared to a regular thermometer. Use it to take your temperature the moment you wake up, even before placing your foot on the floor. Since BBT is usually recorded for a 24 hour period, try to wake up at approximately the same time every day for an accurate recording. This could also help regularise your sleep as an added advantage!
The usual value of BBT ranges from 97.2 to 97.7 degrees Fahrenheit,and ovulation could cause an increment in your normal recording by 0.5 to 1 degree. This would last until your period starts and is what will really help you confirm your ovulation. Your BBT could show some spiking on other days apart from your days of ovulation. However, this would only be for a day or two. Once you ovulate, your BBT tends to be at a higher observed value for all readings from that day until you menstruate.
In case you get pregnant after ovulation, BBT would remain high throughout your pregnancy, thus satisfying the condition that it would remain high until your uterus sheds again.
How Does a BBT Chart Help?
Maintaining a chart can make an otherwise seemingly tedious task interesting. It gives you a graph on joining the dots to see the spikes clearly. This kind of a chart can even help your obstetrician diagnose any fertility or other issues related to your menstrual cycle. Moreover, you can boost your chances of conceiving if you keep a track of certain factors related to your cycle on a daily basis.
Difference Between Body Temperature And Basal Body Temperature
Alright, let’s talk about body temperature and basal body temperature. You might be thinking, “aren’t they the same thing?” Nope, not quite!
Body temperature is your overall temperature, which can vary throughout the day depending on things like exercise, stress, and even the weather. On the other hand, basal body temperature is your body’s temperature when you’re at complete rest, and it’s typically taken first thing in the morning before you get out of bed.
So, how do you take basal body temperature? Well, grab a thermometer (preferably one that measures to two decimal places), and make sure it’s within arm’s reach before you go to bed. In the morning, before you do anything else, pop that thermometer under your tongue and take note of the reading. It might not seem like a big deal, but tracking your basal body temperature can actually give you insight into when you’re most fertile. Yep, that’s right – basal body temperature can be a helpful tool if you’re trying to conceive.
What Is Cervical Mucus (CM)?
Cervical mucus is the vaginal discharge which is secreted by the cervix and its production is stimulated by the hormone oestrogen. The appearance and quantity of cervical mucus keeps changing depending on your menstrual cycle and on your moods or sexual activity. Most importantly, it protects against infection and irritation.
The consistency, colour and odour of vaginal discharge vary from person to person. However, generally, the colour varies from clear to white to slightly off-white, and the odour from mild to non-existent. There are also patterns observed based on the stage of the menstrual cycle:
- Soon after your period, there is very little to no vaginal discharge (known as the ‘dry days’) because of severely reduced oestrogen activity
- After this, you may have a thick discharge (also described as cloudy)
- As you progress towards ovulation, the discharge becomes softer and more liquid in form, allowing for optimum sperm travel (also called the ‘egg white’ stage)
- After ovulation, the discharge becomes thicker but lesser under the influence of progesterone
- This will be followed by your period, and the cycle continues
Predicting Ovulation Using BBT and CM
BBT combined with CM can be an effective and natural way for you to track ovulation and plan sexual activity accordingly. It could help know the right time to try insemination or avoid it if you are looking at natural methods to prevent pregnancy.
The signal for knowing when you are at your peak (fertility wise) is a soft, liquid egg-white discharge suggesting optimum conditions for sperm travel right before your ovulation, followed by an increase in your BBT, indicating ovulation.
Noting your CM with your BBT would be a good idea to take charge of things. Note that it will take time for you to develop the habit and notice the patterns.
Sign That You’re Not Ovulating
When it comes to making a baby, ovulation is like the star player on your team. But what happens when that star player doesn’t show up for the game? Well, that’s when you might start to suspect that you’re not ovulating. And one way to tell is by tracking your basal body temperature (BBT).
If you’re not seeing a consistent temperature rise in your BBT chart, that could be a sign that you’re not ovulating. But don’t jump to conclusions just yet! There could be a variety of reasons why you’re not ovulating, such as stress, weight fluctuations, or hormonal imbalances. The good news is that there are plenty of natural ways to help your body ovulate, like getting enough rest, eating a balanced diet, and exercising regularly. And if you’re still having trouble, don’t hesitate to talk to your doctor. Remember, there’s always a way to get that star player back on the field!
How Accurate Is Ovulation Tracking Using BBT?
So, you’ve been diligently tracking your basal body temperature to try and figure out when you’re ovulating. But how accurate is this method, really?
Well, let’s start with the good news: basal body temperature tracking can be a useful tool in predicting ovulation. When you ovulate, your body releases the hormone progesterone, which causes a slight increase in basal body temperature. By tracking your temperature each day, you may be able to detect this shift and know when you’re most fertile.
However, it’s important to note that basal body temperature tracking isn’t foolproof. There are many factors that can influence your temperature, including illness, stress, alcohol consumption, and even a restless night’s sleep. Plus, you’ll need to track your temperature for several months in order to establish a pattern and accurately predict ovulation. So, while basal body temperature tracking can be a helpful tool, it’s not the only method of ovulation prediction out there.
How to Chart BBT and Cervical Mucus?
If you have a relatively regular cycle, you should be able to plan sexual activity from when you notice the CM becoming egg white and stretchy. You must start trying before the increase in BBT if you want to conceive.
It is better to note the quality of your discharge in the morning. Sometimes you might have to insert a finger up your vagina to clearly examine the nature of your discharge.
Chart your CM and BBT recordings from the first day of your period as soon as you wake up. This is an easy way to go about charting it, also read on for bbt chart examples.
Recording Your BBT Chart
There are several templates available on the internet to chart your BBT and CM. We have included a few towards the end of this article. Use the following steps to record your BBT and CM:
- Begin recording from the first day of your period
- Plan to wake up at the same time every day
- As soon as you wake up, even before sitting up, take your BBT reading and mark a point against the day’s temperature reading. (Place your thermometer at an arm’s distance.)
- Make a note of the date and time
- Move to the washroom to examine your mucus quality. You could do this before you use the washroom in the morning. If you are checking after, be sure not to wash it all off. You could even observe the CM on the toilet paper after you wipe
- Make a note of the CM based on the key provided in your chart. For example, the chart from White Lotus Clinic (see below) has CM types as P= period; D= dry; S= sticky rice; E= egg whites
- As you make recordings, notice that the rise in BBT is usually preceded by the CM turning egg white. The CM turning egg white is when you are most fertile, and a higher BBT will help confirm ovulation.
Phases in BBT Chart
In case you were wondering how to measure basal body temperature, the whole process is explained in a clear manner below. Read through the different phases and know how to mark the chart accordingly.
Women with fairly regular menstrual cycles have two distinct phases in their BBT charts:
- Follicular Phase – You are in this phase from the first day of your period until ovulation. Higher oestrogen activity leads to low temperatures in the range of 97.2 to 97.7 degrees Fahrenheit. As you approach mid-cycle, there might be a sudden noticeable drop which signifies ovulation.
- Luteal Phase – After the sudden drop in temperature, BBT shows a sudden spike and remains high for the rest of the cycle due to progesterone activity. This is why the spike in BBT confirms ovulation. BBT ranges from 97.7 to 98.3 degrees Fahrenheit during the luteal phase.
For a lot of women, on impregnation, the graph would show a third phase, a second rise in body temperature of about 0.7 degrees Fahrenheit more than in the luteal phase; 7-10 days after ovulation. Check this completed BBT pregnancy chart to see the third phase.
Sample BBT Chart for Reference
Here are a few ovulation chart examples of completed BBT-CM, so you get an idea of what they look like after filling:
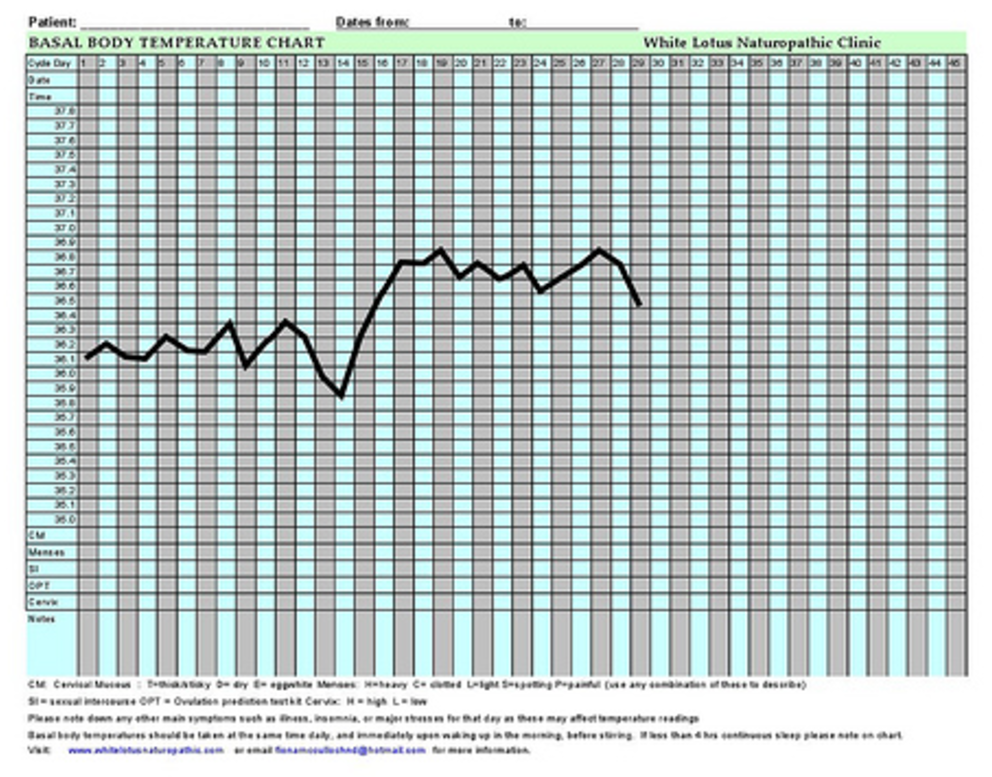
Source: White Lotus Clinic
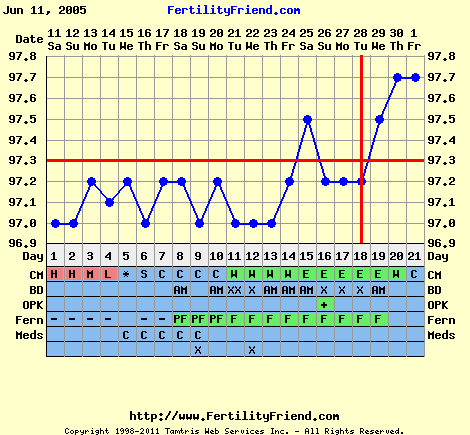
Source: Fertilityfriend.com
How to Read a Basal Body Temperature (BBT) Chart
The answer to the question of how to read a BBT chart is fairly simple and can be explained in a few simple steps. This chart is also called BMT chart (This is for a regular 28 days menstrual cycle).
- The temperature remains at low values from day 1 to day 13
- On day 14, when ovulation occurs for most women there is a sudden dip (marking the end of the follicular phase)
- There is a marked spike on day 15 (beginning of luteal phase)
- The days from 16 to the next day 1 show fairly higher temperatures than usual. So, you get a BBT graph at the end of each cycle.
The sample BBT chart showing pregnancy shows a second rise in temperature from Day 25:
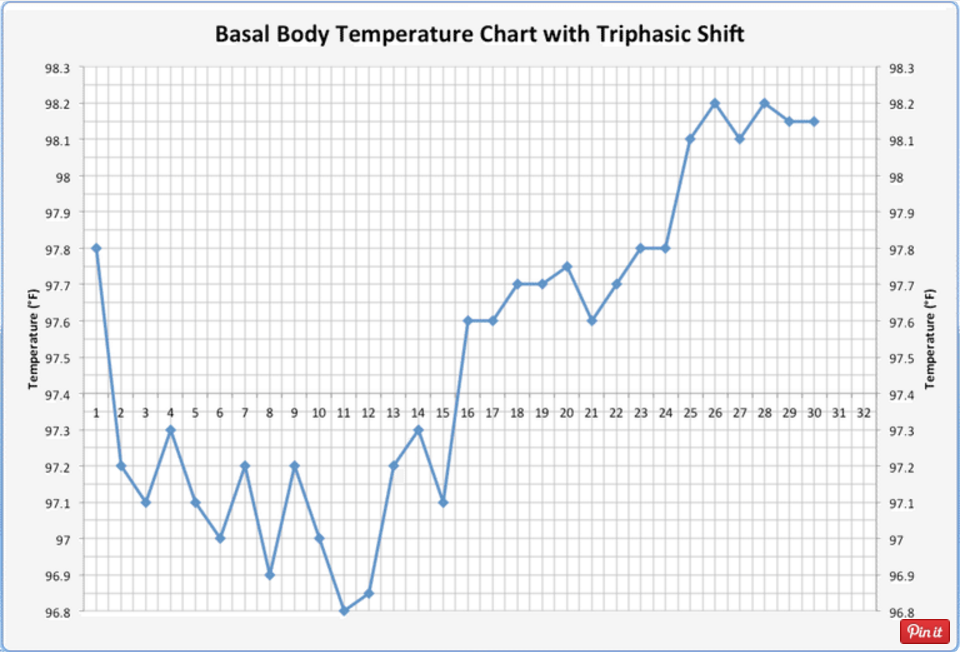
Source: Verywell.com
Blank BBT Chart for Printing
Here is a sample template that you can take print out of to make your own BBT-CM chart:
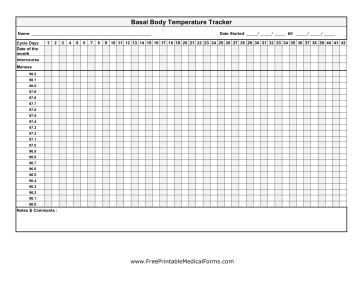 Source: Freeprintablemedicalforms
There are fixed spaces to note every little detail, from the dates covered to the cycle number and specifics for each day of the period. You can note the date, day of the week and the time at which you note the BBT. Mark a dot against the temperature observed. Examine CM type according to the key provided and enter the corresponding letter. Tick or cross the days that you had sex on.
Women tend to lose track of their period and often fumble even when asked about the typical lengths of their periods by the gynaecologist.
A lot of symptoms including susceptibility to cold and digestive sensitivities can often be explained based on your menstrual cycle. Also, natural methods are better than any external intervention to plan your pregnancy.
When To Consult A Doctor?
Tracking your basal body temperature (BBT) can be a helpful tool for understanding your menstrual cycle and predicting ovulation. However, it’s important to know when it’s time to consult a doctor. Here are some signs that it might be time to seek medical advice:
If you’ve been tracking your BBT for several months and have noticed irregularities or inconsistencies, it’s worth discussing with your healthcare provider. They can help determine if there are any underlying issues that need to be addressed.
If you’re actively trying to conceive and have been tracking your BBT without success for several months, it’s also a good idea to speak with your doctor. They can evaluate whether there are any fertility issues at play and recommend appropriate treatments or interventions.
Remember, knowledge is power when it comes to reproductive health. By working with a healthcare professional and utilizing tools like BBT tracking, you can take charge of your menstrual cycle and make informed decisions about your fertility journey.
FAQs
Does BBT Increases After Implantation?
Ah, the great BBT mystery! Does it rise after implantation or not? Well, the answer is… it’s complicated. See, BBT stands for Basal Body Temperature, which is your body’s temperature at rest. And while it can give you clues about your ovulation and fertility, it’s not a perfect science.
That being said, some women do experience a slight increase in BBT after implantation. This is because when the fertilized egg implants in the uterine lining, it releases a hormone called hCG, which can cause a rise in temperature. But here’s the catch: not every woman experiences this, and other factors like illness, stress, and poor sleep can also affect BBT. So, while it’s tempting to obsess over your BBT chart, it’s important to remember that it’s just one piece of the fertility puzzle.
Can You Get Pregnant If Your BBT Drop?
Oh, BBT, why must you be so tricky? Here’s the deal: while a drop in basal body temperature can be a sign that ovulation has occurred, it doesn’t necessarily mean you have no chance at having a seat on the pregnancy journey. In fact, if you conceive, your BBT may actually drop slightly around the time of implantation.
Now, let’s back up for a second. If you’re not familiar with BBT, it’s a method of tracking your fertility by taking your temperature first thing in the morning before you get out of bed. By charting your BBT over time, you can see when ovulation occurs and time intercourse accordingly. But just because your temperature drops after ovulation doesn’t mean you’re not pregnant. In fact, some women experience what’s called an implantation dip, where their BBT drops slightly around the time of implantation. So, if you’re trying to conceive and notice a drop in your BBT, don’t give up hope just yet!
Understanding your BBT chart will help you take things into your own hands and understand the signals your reproductive system gives you. Tracking your BBT and CM helps you plan better at your own end. Right from how to take basal body temperature to figuring out the basal body temperature if you conceive, this article helps you through it all. Whether or not you are planning to start a family, these indicators will surely be of huge importance to make that call.
Was This Article Helpful?
Parenting is a huge responsibility, for you as a caregiver, but also for us as a parenting content platform. We understand that and take our responsibility of creating credible content seriously. FirstCry Parenting articles are written and published only after extensive research using factually sound references to deliver quality content that is accurate, validated by experts, and completely reliable. To understand how we go about creating content that is credible, read our editorial policy here.
- Author
- Expert Reviewer
Related Articles
-

How to Get Pregnant Fast After Depo Shot?
-
15+ Best Home Remedies to Help You Get Pregnant
-
Dollar Store Pregnancy Test: When to Take, Accuracy & more
-
Can Delayed Ovulation Affect Your Chances of Getting Pregnant?
-
The Ramzi Theory for Gender Prediction - Does It Really Work?
-
Finding Your Fertile Window: How to Calculate It


")


